Introduction & Context
This dashboard tracks near real-time battery storage dispatch across Victoria in the National Electricity Market (NEM). It visualises energy output from grid-connected battery systems using SCADA data published by AEMO. The goal is to present short term battery dispatch trends, highlight system contributions, and support power network dashboard storytelling around energy storage infrastructure.
Problem / Observation Goal
Battery storage plays a growing role in grid stability and renewable integration, but dispatch data is fragmented across participant DUIDs and published on the NEMWeb as raw CSV files. This dashboard consolidates SCADA values from all registered major battery systems, converting instantaneous MW into energy (MWh) and presenting time-series trends for operational insight and portfolio visibility.
Data Sources & Collection
- Data Source: AEMO Dispatch_SCADA dataset via NEMWeb.
- Participant Source: AEMO Registered Participants
- ETL: Python script (
GetStore_Dispatch_SCADA.py) running on Raspberry Pi 5 - Database: PostgreSQL storing timestamped SCADA records with DUID mapping
- Visualisation: Grafana dashboards with per-system energy overlays
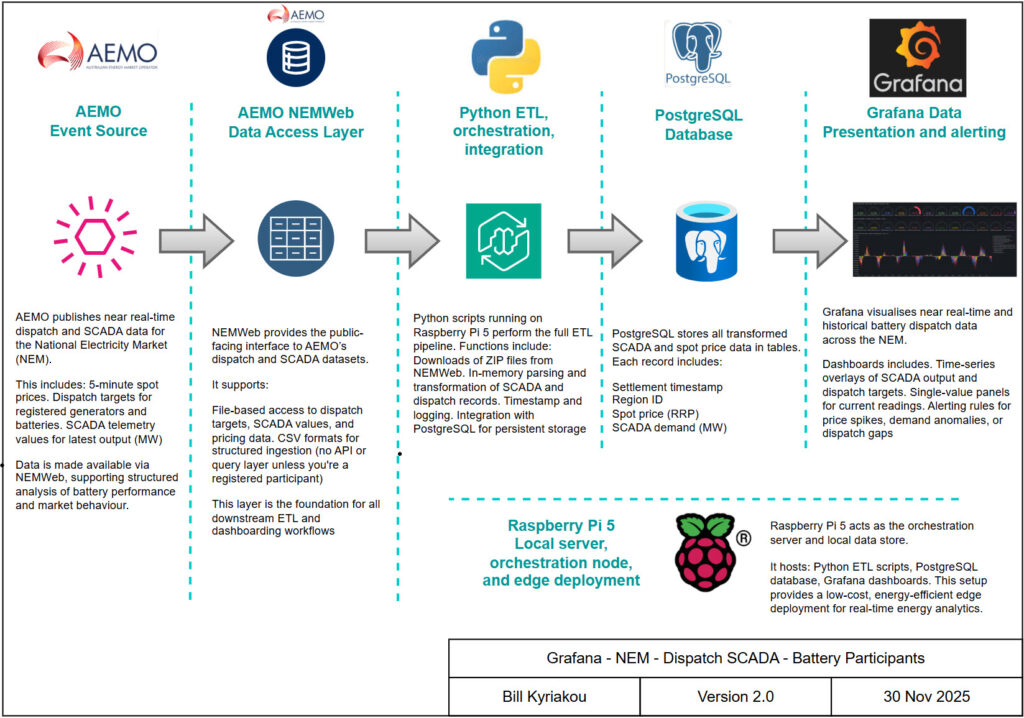
- Hardware: Raspberry Pi 5 acting as edge node and orchestration server
Design Philosophy & Dashboard Approach
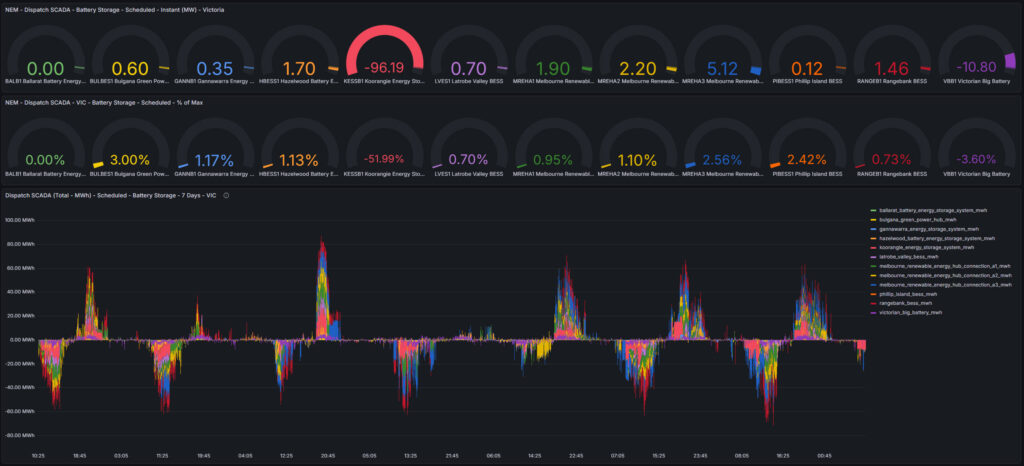
The dashboard is designed for clarity and dispatch visibility. Each battery system is represented individually as a Guage showing its latest SCADA MW value as well as a percentage based on the maximum output on the battery system. Either Positive for discharging or negative for charging. Secondly as a stacked time-series bar graph, showing energy output in MWh over the past 7 days. Instantaneous MW values are converted using a 5-minute interval multiplier (5/60) and grouped by settlement timestamp.
System Architecture
Data flow: NEMWeb → Python ETL → PostgreSQL → Grafana
- Python script connects to NEMWeb Dispatch_SCADA index and downloads new ZIP files
- CSV files are parsed in memory, filtering rows starting with ‘D’
- SCADA values are upserted into PostgreSQL with structured logging and AEDT timestamps
- Grafana queries aggregate SCADA values per DUID, converting MW to MWh and grouping by time

Dashboard Showcase
- Time-series graph shows dispatch energy (MWh) for each battery system over 7 days
- Systems include Ballarat, Bulgana, Hazelwood, Latrobe Valley, Rangebank, Victorian Big Battery, and others
- SQL filters by region (VIC1), fuel type (Battery Storage), and descriptor (Grid)
- Overlayed lines highlight dispatch patterns, peak events, and system contributions

Outcomes & Insights
- Dispatch visibility: Near real-time and historical energy output is now trackable per system registered battery participant per region
- System comparison: Victorian Big Battery shows consistent dispatch; smaller systems show intermittent spikes
- Operational reliability: Raspberry Pi 5 and PostgreSQL ingest and serve data continuously
- SCADA transformation: Instantaneous MW values are converted to MWh for energy analysis
Lessons Learned
- ZIP file parsing must handle missing or malformed CSVs gracefully
- Scripting logic prevents data file duplication and ensures latest values are stored
- Grafana panels benefit from consistent DUID naming and SQL filtering
- Modular ingestion pipelines scale — same structure can be reused for other fuel types or regions
Future Development & Fixes
- X-Axis date and time needs to be fixed in Grafana. Currently exploring options. Should be an easy fix.
- Integrate weather overlays to correlate dispatch with solar/wind conditions
- Create another dashboard to include all regions with battery in a single visualisation
- Automated update of registered participants from MS Excel spreadsheet as a metadata table