Background
Grafana is an open-source platform that visualises metrics, logs, and traces from tools like Prometheus, Loki, and Alloy (formally called Promtail). Grafana alloys you to display dashboards by connecting to raw data.
Grafana versions evolve very fast. New versions bring performance improvements, security patches, and new features like enhanced alerting, unified panels, and better integrations with Loki and Alloy. Staying updated ensures your dashboards remain compatible, secure, and future-proof.
Update process
Check your current Grafana version
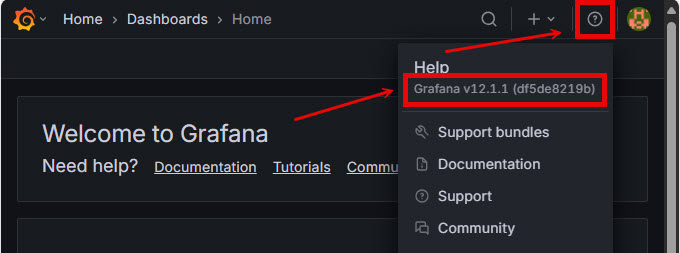
grafana-cli -v…or directly from Grafana running in your browser. Also “http://localhost:3000“
Update via APT Repository
This process pulls the latest stable version from Grafana’s official repository. The current configured dashboards, users, and data sources will remain intact. Start with updating the package list and then update Grafana.
sudo apt update

sudo apt upgrade grafanaRestart Grafana and verify
sudo systemctl restart grafana-server

sudo systemctl status grafana-serverAlso, a good idea to restart the “systemd” in case system definitions were changed
sudo systemctl daemon-reloadIts a simple process to upgrade. Log into Grafana and check the visualiations to ensure correct operations.
Hope that helps.