Introduction & Context
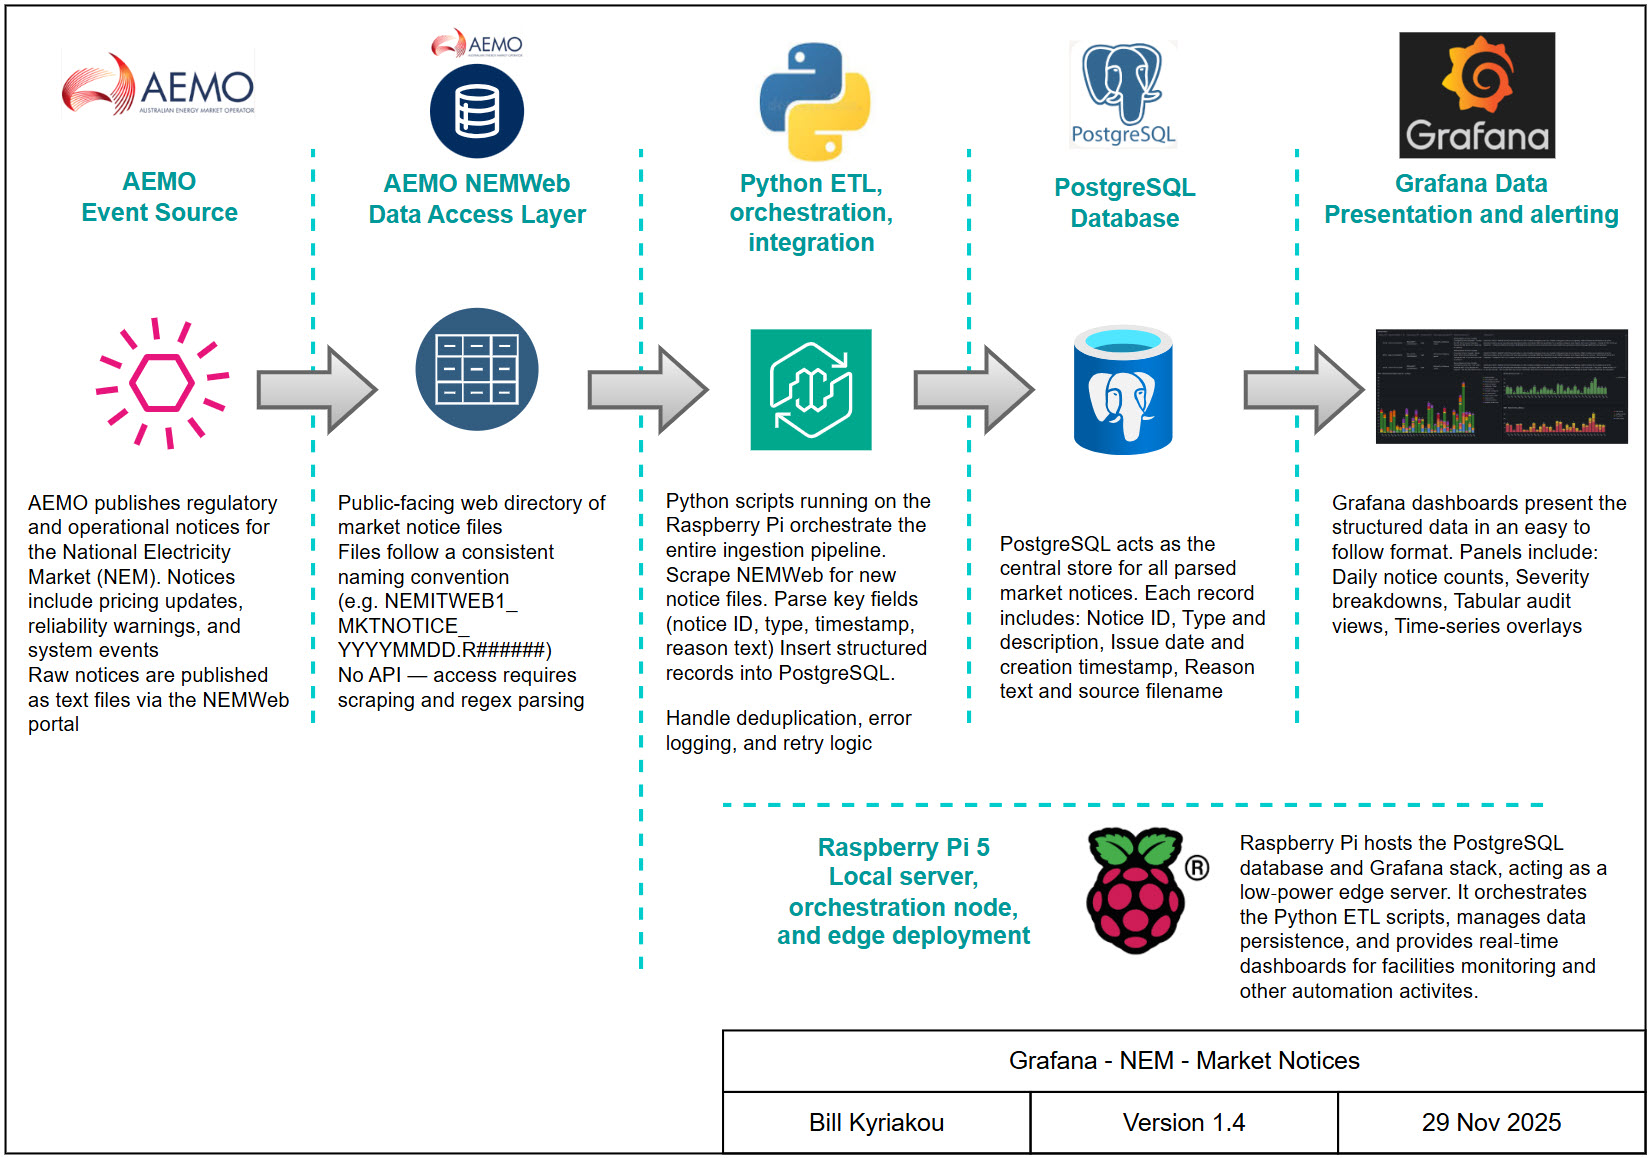
This project ingests and visualises electricity market notices published by AEMO via the NEMWeb portal. These notices include pricing updates, reliability warnings, and operational events. The goal is to transform raw text files into structured, queryable records and dashboards that support compliance, monitoring, and visual storytelling.
Problem / Observation Goal
AEMO publishes market notices as static text files on NEMWeb. While consistent, these files are not machine readable and cannot be queried directly. The challenge was to build an ETL pipeline that scrapes, parses, and stores notices in a structured database, enabling dashboards that reveal frequency, type, severity, and operational impact.
Data Sources & Collection
- Source: NEMWeb Market Notice feed
- ETL: Python scripts using requests, regex, psycopg2, datetime
- Database: PostgreSQL for structured storage and indexing
- Visualisation: Grafana dashboards for counts, severities, and text audit tables
- Hardware: Raspberry Pi 5 hosting ETL scripts, PostgreSQL and Grafana
Design Philosophy & Dashboard Approach
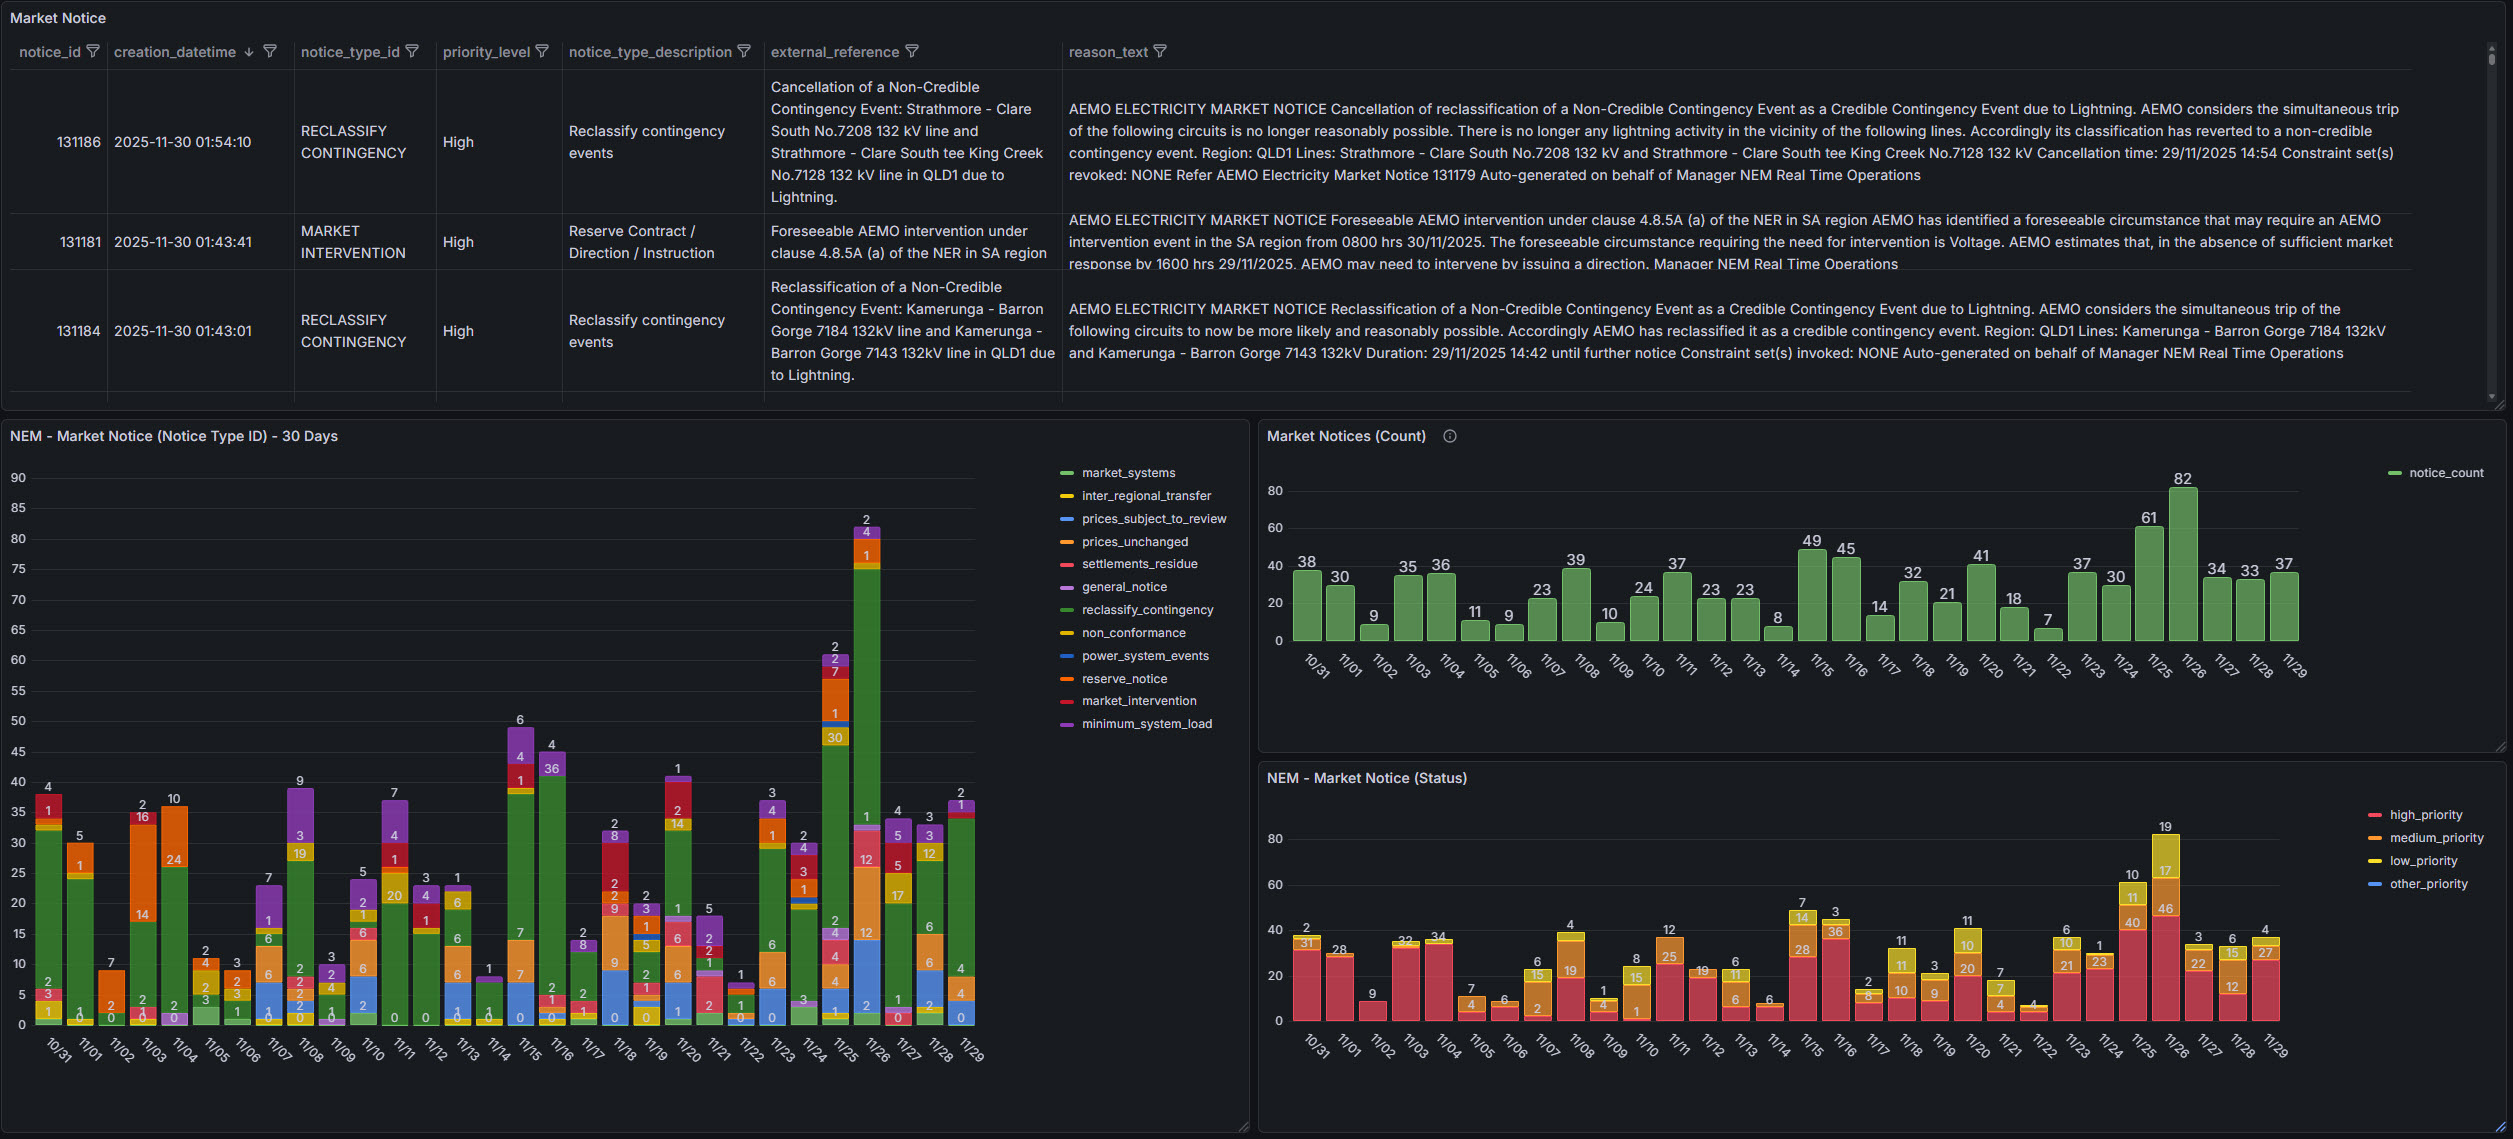
The dashboard is designed for clarity and operational storytelling. Bar charts show daily notice counts, stacked panels highlight severity distributions, and tables provide auditability. Colour-coding and timestamps make market anomalies easy to spot, while layout design emphasises trend visibility over text-heavy detail.
System Architecture
Data flow: NEMWeb → Python ETL → PostgreSQL → Grafana
- Python scripts scrape NEMWeb for new notice files
- Regex parsing extracts notice ID, type, timestamps, and reason text
- PostgreSQL stores structured records with creation_datetime for accuracy
- Grafana queries indexed tables to render dashboards in real time

Dashboard Showcase
• Metric taxonomy table defines each market metric with clear labels for type, subtype, and description. This enables structured filtering and auditability.
• 30-day time series panel visualises realised and implied volatility, spreads, and market moves — highlighting short-term trends and Fed-related contingencies.
• Metric count panel tracks frequency of each metric type over time, supporting anomaly detection and operational storytelling.
• Stacked bar chart categorises metrics by count, type and severity offering a high-level view of market behaviour and market event clustering.

Outcomes & Insights
- Early anomaly detection: Spikes in high-priority notices are visible instantly
- Operational reliability: ETL pipeline consistently ingests and stores notices without interruption
- Actionable visibility: Dashboards support compliance, monitoring, and storytelling
- Data integrity: Fixing the timestamp bug ensured accurate creation times instead of default 11:00 values
Lessons Learned
- Visual clarity matters – dashboards must emphasise trends
- Modularity scales – the ingestion setup is (mostly) reusable across other NEMWeb datasets
Future Development & Fixes
- Cross-reference notices with weather data for correlation analysis
- Expand dashboards with trend overlays