Introduction & Context
This dashboard tracks two critical signals in the National Electricity Market (NEM):
- Spot Price – the Regional Reference Price (RRP) 5‑minute wholesale price of electricity in each region.
- SCADA Demand – the real‑time measured demand from Supervisory Control and Data Acquisition systems.
Together, these values provide a clear picture of short‑term market dynamics, showing how demand fluctuations drive price volatility
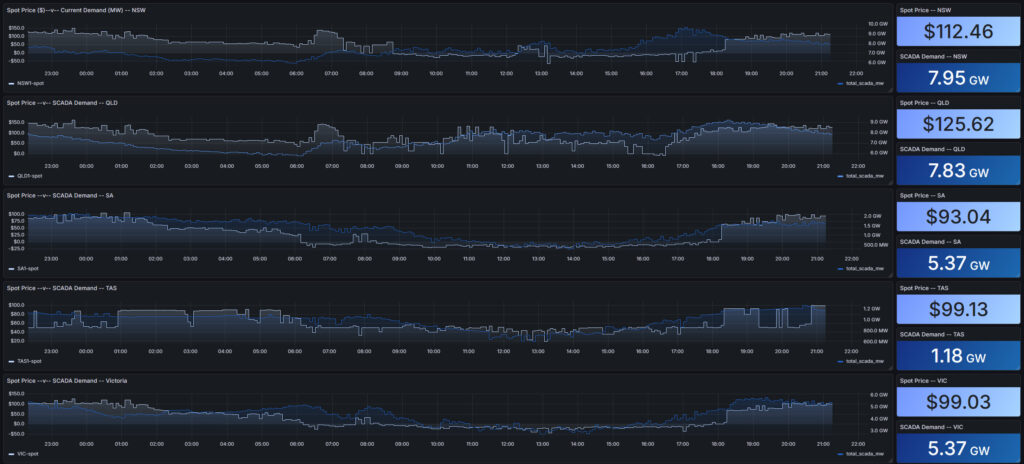
We can now visualises near real-time spot prices and SCADA demand across the National Electricity Market (NEM). It provides a state-by-state breakdown of current prices and demand, using AEMO’s dispatch datasets. The goal is to surface short-term volatility, demand spikes, and regional dynamics in a format that supports operational monitoring and recruiter-facing storytelling.
Problem / Observation Goal
Spot prices and SCADA demand are published separately by AEMO, making it difficult to correlate price volatility with real-time demand. This dashboard was built to combine both datasets into a unified view, enabling anomaly detection, regional comparison, and short-term forecasting.
Data Sources & Collection
- Source: AEMO RRP spot price and SCADA datasets via NEMWeb
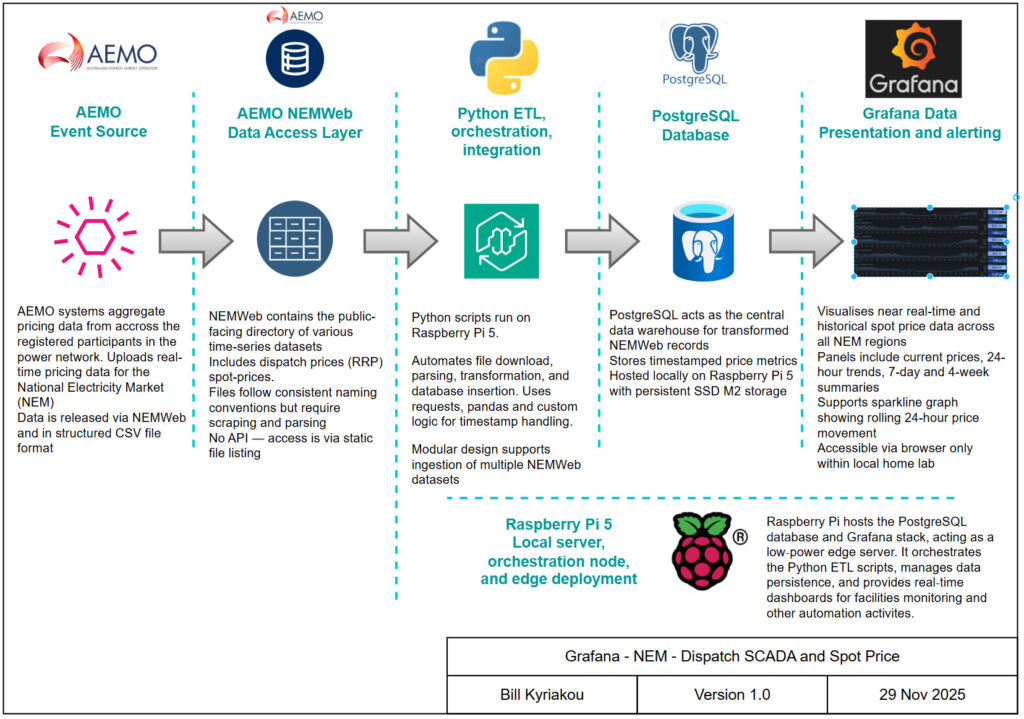
- ETL: Python scripts scheduled on Raspberry Pi 5
- Database: PostgreSQL storing timestamped dispatch and SCADA records
- Visualisation: Grafana dashboards with region-level panels and trend overlays
- Hardware: Raspberry Pi 5 acting as edge node and orchestration server
Design Philosophy & Dashboard Approach
The dashboard is designed for clarity and short-term trend visibility. Each region has its own panel showing:
- Spot price (5-minute resolution)
- SCADA demand in MW
- Time-series graph of price and demand correlation
- Real-time single-value panels for current readings
This layout supports fast anomaly detection and operational storytelling across NSW, QLD, SA, TAS, and VIC.
System Architecture
Data flow: NEMWeb → Python ETL → PostgreSQL → Grafana
- Python scripts fetch dispatch and SCADA files from NEMWeb
- SQL queries extract region-level spot prices and aggregate SCADA demand
- PostgreSQL stores structured records with indexed timestamps
- Grafana queries the database and renders dashboards in real time

Dashboard Showcase
- Real-time panels show current spot price and SCADA demand for each region
- Time-series graphs overlay price and demand, highlighting short-term volatility
- Panels are colour-coded for instant anomaly detection and regional comparison
- Supports operational monitoring and recruiter-facing insights into energy market dynamics

Outcomes & Insights
- Price-demand correlation: Spot price spikes often align with SCADA demand surges
- Regional volatility: NSW and QLD show sharper swings compared to TAS and VIC
- Operational reliability: Raspberry Pi 5 and PostgreSQL setup ingests and serves data continuously
- SQL efficiency: Queries are optimised for Grafana panels with 24-hour rolling windows
Lessons Learned
- Time zone handling is critical — all timestamps are normalised to UTC for Grafana compatibility
- SCADA aggregation requires careful JOIN logic to avoid duplication or null values
- Visual clarity matters — region-level panels outperform multi-region overlays for recruiter storytelling
- Modular ingestion pipelines scale — same structure can be reused for FCAS, interconnectors, and forecasts
Future Development & Fixes
- Add Prometheus exporters for alerting on price spikes and demand surges
- Integrate weather overlays to explain demand anomalies
- Expand dashboard to include FCAS prices and interconnector flows
- Refactor SQL to support dynamic region selection and longer time windows