Introduction & Context
This dashboard showcases a compact, modular environmental monitoring system built using an Arduino R4 WiFi and a DFRobot BME280 sensor. The goal was to create a reliable, low-cost solution for capturing and visualising real-time environmental data.
Specifically, temperature, pressure, and humidity. In a format suitable for operational diagnostics, facilities management, and my technical portfolio demonstration.
The dashboard is part of a broader effort to demonstrate hands-on IoT integration, Python-based ETL, and Grafana visualisation pipelines, all running on a Raspberry Pi home lab environment.
Problem / Observation Goal
The primary objective of this dashboard is to monitor outdoor environmental to observe:
- Temperature
- Humidity
- Barometric Pressure
Capturing this data long-term allows for tracking of microclimate trends for building performance and comfort analysis
This setup is particularly useful for evaluating house insulation and managing heat and cold, while real‑time weather data provides the context needed to understand how outdoor conditions influence indoor comfort and maintenance needs.
Data Sources & Collection
This stack is intentionally simple, modular, and reproducible:
- Arduino R4 WiFi: Hosts a lightweight web server exposing a endpoint with live sensor readings
- DFRobot BME280 Sensor: Captures temperature (°C), pressure (hPa), and humidity (%) with high precision
- Raspberry Pi: Runs the Python ETL script on a scheduled basis (via cron or systemd)
- Python ETL (
requests,psycopg2,dateline): Polls the Arduino, parses JSON, and inserts records into PostgreSQL - PostgreSQL: Stores time-series sensor data in a table (
bme280_env_sensor) with timestamped entries - Grafana: Visualises both real-time and historical trends using PostgreSQL as a data source
Design Philosophy & Dashboard Approach
The dashboard layout is designed for clarity, operational relevance, and recruiter-facing storytelling:
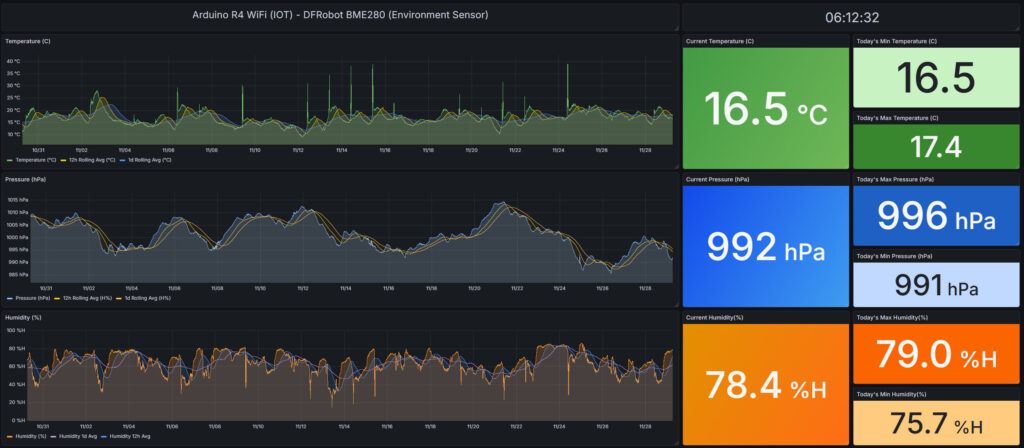
- Left Column (Trends): Three stacked line graphs for temperature, pressure, and humidity, each showing dual time series (e.g., raw vs. smoothed or indoor vs. outdoor)
- Right Column (Current State): Single-value panels showing current readings and daily min/max values for each metric
- Top Center: Real-time clock for temporal context
- Visual Priorities:
- Immediate visibility of anomalies (e.g., pressure dips, humidity spikes)
- Clean, uncluttered layout with consistent units and colour schemes
- No alerts or thresholds yet — this is a passive monitoring dashboard, with future plans for active alerting
System Architecture
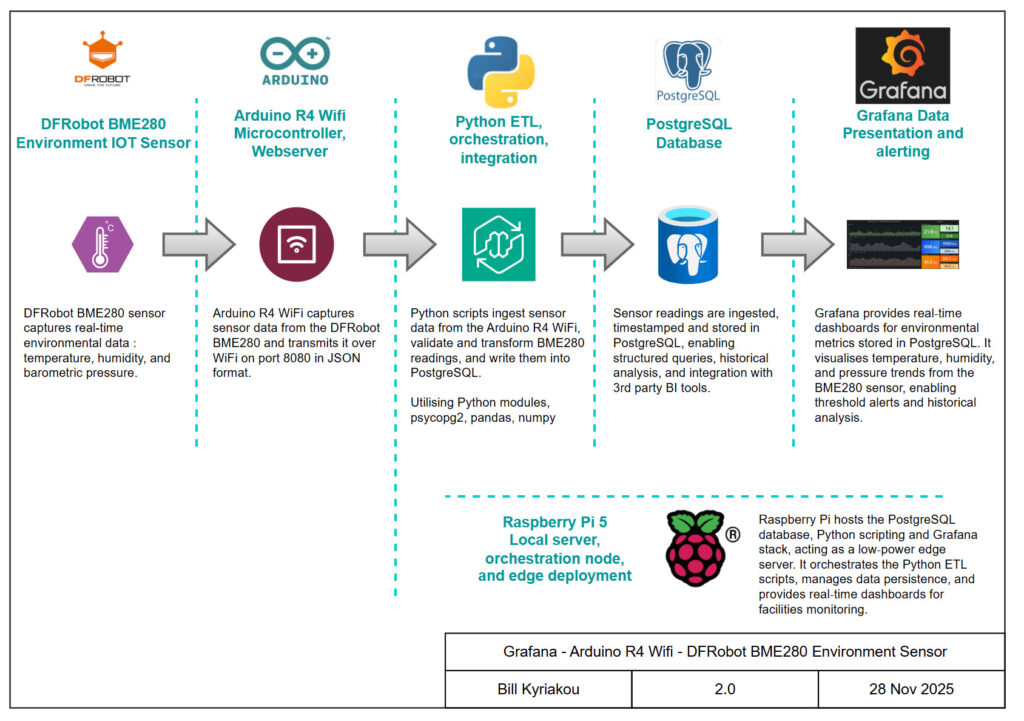
The system follows a clean, narratable data flow:
Sensors → Python ETL → PostgreSQL → Grafana
- The Arduino R4 WiFi serves JSON data from the BME280 sensor
- A Python script fetches this data every few minutes and inserts it into PostgreSQL
- Grafana queries the database and renders the dashboard every 5 minutes
This architecture is designed for modularity and transparency, making it easy to extend with additional sensors, exporters, or alerting logic.

Arduino R4
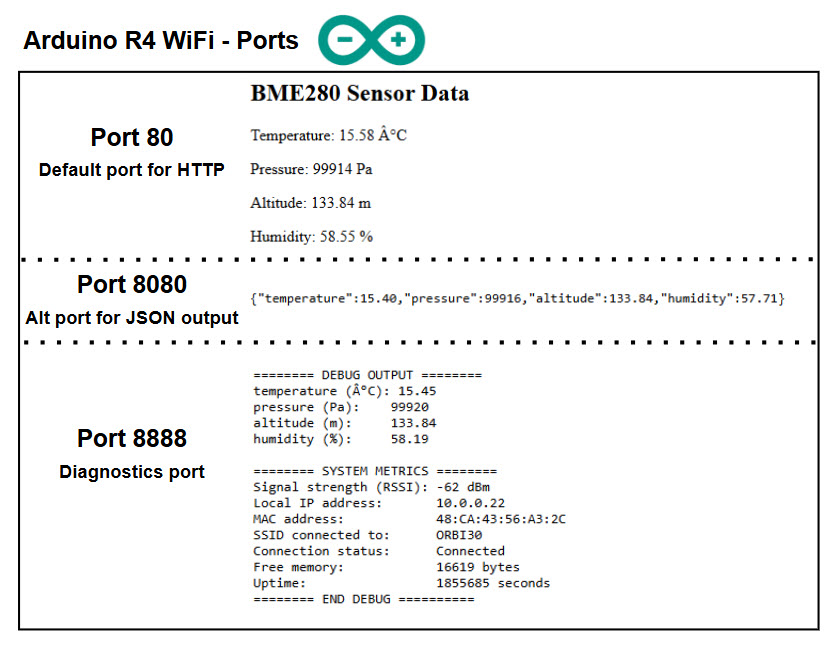
My Arduino R4 WiFi setup uses three network ports to separate data outputs:
- Port 80 serves browser friendly output sensor readings typically seen on the serial interface.
- Port 8080 delivers structured JSON for API use.
- Port 8888 provides detailed debug logs and system metrics. It’s a clean, narratable design ideal for IoT dashboards.

Dashboard Showcase
Version 2.0
- Environmental Dashboard Screenshot
- Top left: Temperature trend; middle left: Pressure trend; bottom left: Humidity trend. Right column shows current values and daily min/max for each metric.
Key visual elements:
- Line Graphs: Reveal short-term and daily, highly granular trends
- Single-Value Panels: Provide operational snapshot at a glance
- Time Synchronisation and regular refresh: Ensures data freshness and temporal accuracy

Version 1.0
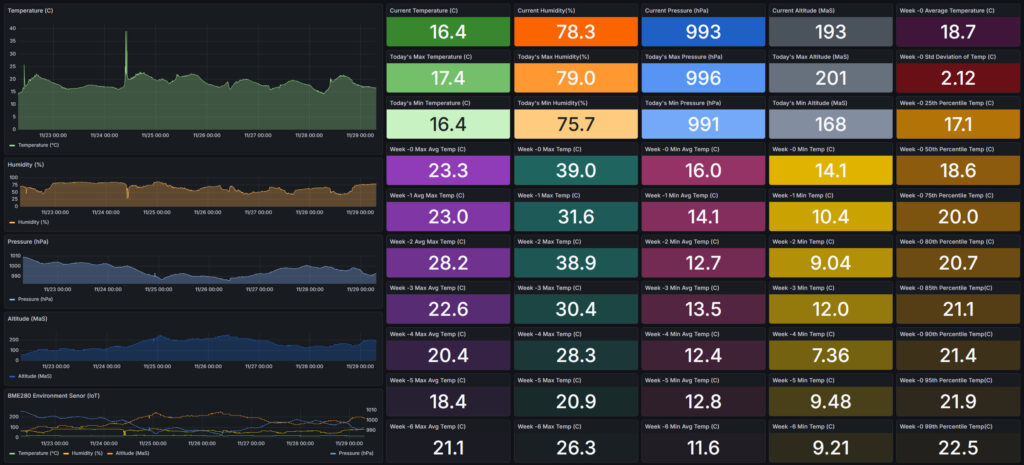
The original dashboard provided a comprehensive overview of environmental metrics, including temperature, humidity, pressure and altitude. While technically complete, it leaned too heavily on text-heavy tiles and numerical summaries, which made it visually dense and harder to interpret at a glance. From a usability and storytelling perspective, the layout lacked trend‑oriented visualisations that would have better conveyed environmental shifts over time. Key omissions included:
The decision to replace it was driven by a desire for leaner, more narratable dashboards that priorities clarity, operational relevance, and readability. The new dashboard uses fewer text boxes, more intuitive graphs, and a cleaner layout that highlights latest environmental readings alongside short-term trends making it easier to spot anomalies and communicate insights without overwhelming detail.

Outcomes & Insights
- Accurate environment reporting – The dashboard highlighted short‑term fluctuations such as pressure dips and humidity spikes, allowing correlation with external weather changes and ventilation events. Data can be compared to BOM environment data.
- Operational reliability validated – Continuous polling from the Arduino R4 WiFi endpoint provided a steady stream of sensor data. Introducing the Arduino watchdog timer ensured the device could automatically restart when needed, eliminating the reliability issues that previously caused daily data gaps and manual resets. Physical shielding of the BME280 from direct sunlight stopped temperature spikes skewing data. The Raspberry Pi collected the JSON output via port 8080 and inserted records into PostgreSQL without interruption. This confirmed that the Python ETL pipeline is robust enough for long‑term monitoring, while the daily min/max panels in Grafana further validated the integrity and consistency of the database.
- Environmental visibility – Real‑time single‑value panels (current temperature, pressure, humidity) combined with historical trends provided immediate context. This visibility supports decisions around insulation performance, heating/cooling efficiency, and outdoor maintenance timing.
- Foundation for asset management practices – By linking raw sensor data to Grafana dashboards, the setup demonstrates how IOT telemetry can underpin proactive facilities management — from identifying comfort issues to planning preventative maintenance.
Lessons Learned
- Network resilience matters: The Arduino’s WiFi endpoint is simple but needed retry logic and timeout handling
- Schema design is critical: A narrow, timestamped table not utilising any joins ensures fast Grafana queries
- Modularity pays off: Each component (sensor, ETL, DB, dashboard) can be easily updated.
- Visual clarity wins: Dashboards should prioritise readability and operational storytelling so ongoing refinement is essential
Future Development & Fixes
- Add Prometheus exporters for real-time metrics scraping and alerting
- Aggregate historical data to reduce PostgreSQL storage footprint over time
- Expand sensor network to include multiple nodes and correlate environmental zones
- Monitor all stages of the script and report on the success of each function as the scripts are executed.