Introduction & Context
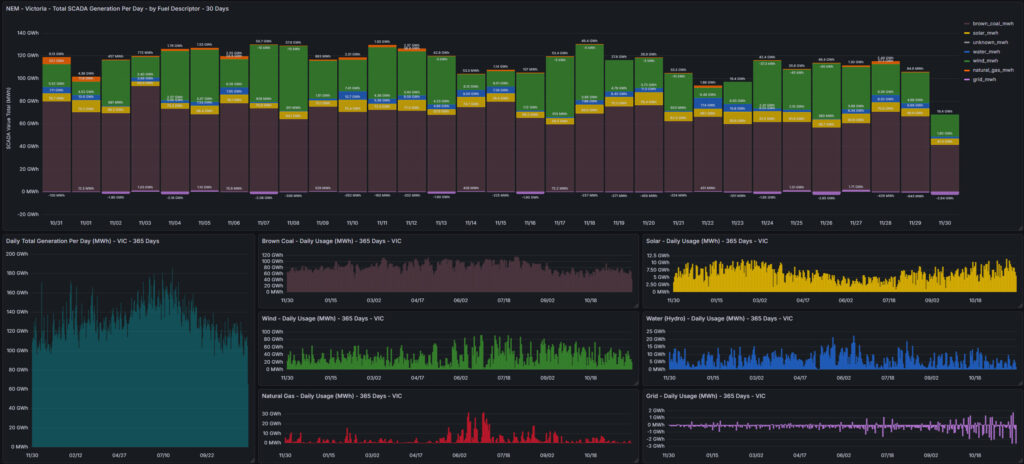
This dashboard primarily aggregates 30 days of Dispatch_SCADA data to show total daily energy (MWh) by fuel descriptor for all NEM regions (NSW,QLD, SA, TAS and VIC). It visualises how different registered assets contribute to the energy mix, using both a stacked daily view alongside per‑fuel time‑series panels for focused longer trend analysis. The aim is a clear story of supply composition and short‑term dynamics.
Problem / Observation Goal
Raw SCADA values are instantaneous MW per DUID, scattered across many assets and fuel descriptors. This page consolidates them into daily energy (MWh) by fuel class, making it easy to compare contributions, spot seasonal patterns, and identify anomalies (e.g., solar dips on cloudy days, wind surges, gas coverage during low renewables and seasonal supply variations). It supports both operational monitoring and portfolio narration showing my capabilities.
Data sources & collection
- Source: AEMO NEMWeb Dispatch_SCADA (5‑minute telemetry) joined to DUID Registration metadata for region and fuel classification.
- ETL: Python loader (GetStore_Dispatch_SCADA.py) fetches and parses ZIPs, filters “D” rows, and upserts into PostgreSQL with structured JSON logs.
- Database: PostgreSQL stores settlement timestamps, DUIDs, SCADA values (MW), last changed, filename, and fetched_at lineage.
- Visualisation: Grafana queries aggregate daily MWh by fuel descriptor and render stacked bars plus per‑fuel time series.
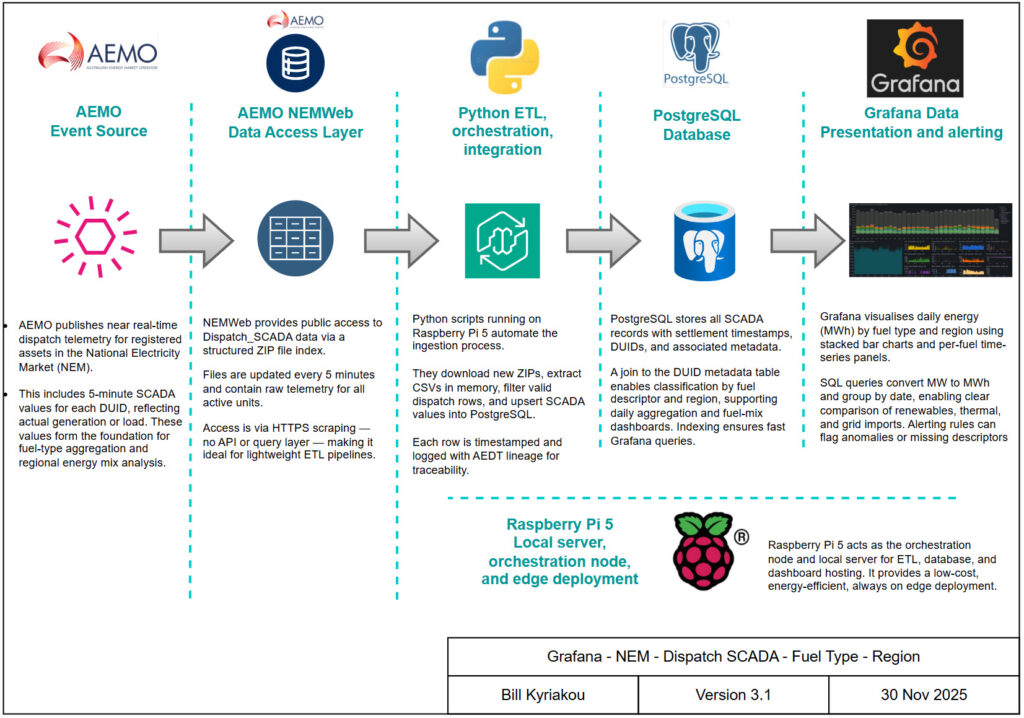
- Hardware: Raspberry Pi 5 hosts ETL, database, and Grafana for a low‑cost, edge deployment.
Design philosophy & dashboard approach
The layout is lean and comparative. Daily totals are computed by converting 5‑minute MW to MWh (MW × 5/60) and summing by fuel descriptor per day. A stacked bar chart shows total daily generation segmented by fuel, while smaller panels show individual fuel trends for quick pattern recognition. This balances high‑level composition with focused, narratable insights. Each region has its own visualisaiton
System architecture
- Ingestion: Python script connects to NEMWeb index, downloads new ZIPs, extracts CSV in memory, filters valid dispatch rows, and upserts to
dispatch_scada. - Classification: Join
dispatch_scadatoduid_metadatafrom participant registration spreadsheet to map DUID to region (i.e VIC1) and link to corresponding fuel descriptor (e.g., Solar, Wind, Natural Gas, Water, Brown Coal, Grid and Unknown [as a catch all bucket if a new fuel type is added but not found in the current registration metadata table]). - Aggregation: Grafana SQL groups by
DATE(settlement_date), sums MWh byfuel_descriptor, and orders by days. - Presentation: Stacked daily bars for total mix; per‑fuel time‑series panels for depth; consistent colors per fuel type.

Dashboard showcase
- Stacked daily energy: 30‑day “Total Generation by Fuel (MWh)” with segments for Solar, Wind, Natural Gas, Water (Hydro), Brown Coal, Grid (imports/utility), and Unknown (catch-all).
- Per‑fuel panels: Individual time‑series (MWh/day) for Solar, Wind, Hydro (Water), Gas, Biomass/Other (where available as regions vary by available fuel types), and a Total panel for quick context.
- Regional filter: SQL region constrained to
dm.region = 'VIC1'to keep the mix relevant to Victorian assets. - Operational clarity: Daily grouping smooths 5‑minute noise while preserving short‑term variability and event detection.

Outcomes & insights
- Energy mix clarity: The stacked view reveals renewable vs thermal balance and the role of hydro and gas during low wind/solar periods.
- Daily variability: Solar tracks daylight/cloud cover; wind shows episodic surges; gas/hydro flex to cover gaps. Black coal prominent in NSW and QLD. Brown coal in VIC. Hydro dominant in TAS
- Data lineage: Every record carries filename and fetched_at, supporting auditable ETL and reproducible analysis and auditing checks.
- Analyst‑ready: The per‑fuel panels make it easy to narrate week‑over‑week changes, seasonal changes and highlight notable events.
Lessons learned
- MW → MWh conversion: Converting 5‑minute MW to MWh (× 5/60) is essential for energy‑based comparisons.
- Fuel descriptors vary: Some assets report uncommon descriptors; keep Unknown category to catch new fuel types.
- Join hygiene: DUID metadata cardinality matters; ensure a clean one‑to‑one DUID to descriptor mapping avoiding duplicated counting.
- Daily grouping: DATE() grouping improves day to day readability but hides intra‑day spikes; keep raw panels available if needed.
Future development & fixes
- Expand categories: Re‑enable commented descriptors (Black Coal, Diesel, Bagasse, etc.) with color scheme and legend discipline.
- Charge/discharge nuance: Classify batteries by directionality and report daily net energy by descriptor.
- Cross‑region view: Add NSW/SA stacked mixes for comparative analysis with synchronized axes.
- X‑axis tidying: Normalize timestamps to UTC and cast to proper time type in queries for cleaner Grafana labels.
- Data QC: Add alerts for sudden descriptor shifts or day‑to‑day anomalies exceeding set thresholds.